2020 was off to a brisk start in our in local market against the back drop of low unemployment, a robust stock market and low interest rates. Momentum was strong as we were transitioning into Spring. Then, the world went on pause. Today, inventory levels are even lower and market times are longer due to the “Stay at Home” order in effect since March 19th. Virtual tours have replaced open houses and showings are limited to those who provide financial qualification and follow CDC and city guidelines. CHOICE is the key word for buyers now. Rarely does one have the opportunity to choose the street, the property and have limited competition for purchasing. Mortgage interest rates are at historic lows! Some Sellers are sitting on the sidelines and others are choosing to proceed. Each situation is different. We are busy and all embracing technology in new ways to meet the market and it is shifting how aspects of the business gets done, perhaps for the better.
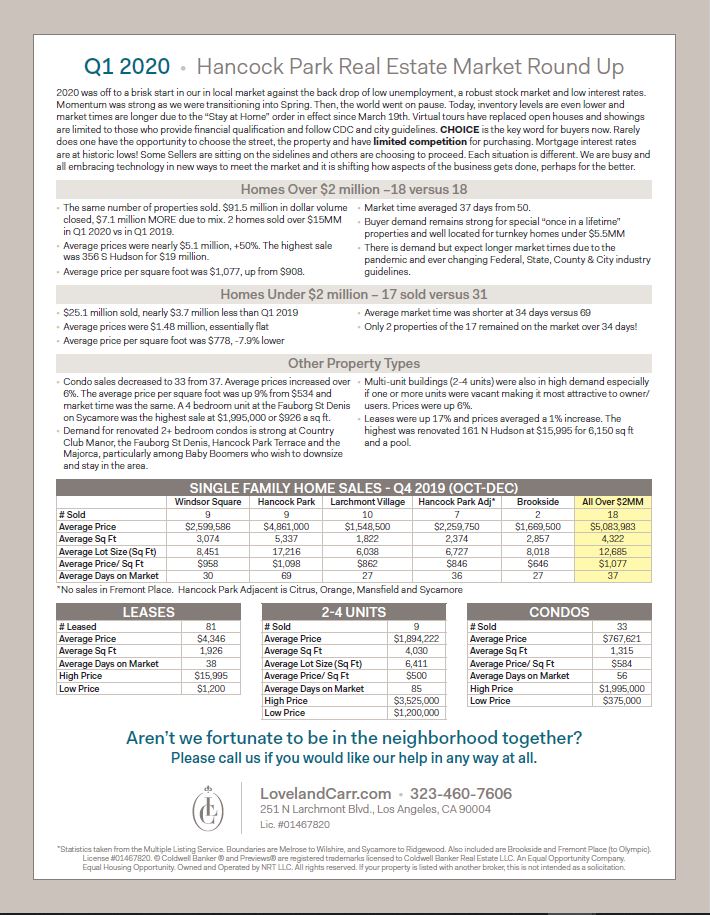
Homes Over $2 million –18 versus 18
•The same number of properties sold. $91.5 million in dollar volume closed, $7.1 million MORE due to mix. 2 homes sold over $15MM in Q1 2020 vs in Q1 2019.
•Average prices were nearly $5.1 million, +50%. The highest sale was 356 S Hudson for $19 million.
•Average price per square foot was $1,077, up from $908.
•Market time averaged 37 days from 50.
•Buyer demand remains strong for special “once in a lifetime” properties and well located for turnkey homes under $5.5MM
•There is demand but expect longer market times due to the pandemic and ever changing Federal, State, County & City industry guidelines.
Homes Under $2 million – 17 sold versus 31
•$25.1 million sold, nearly $3.7 million less than Q1 2019
•Average prices were $1.48 million, essentially flat
•Average price per square foot was $778, -7.9% lower
•Average market time was shorter at 34 days versus 69
•Only 2 properties of the 17 remained on the market over 34 days!